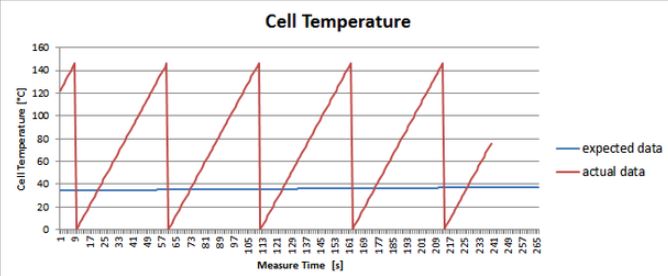
During charging you monitor the cell temperatures by tapping the BMS CAN Bus. The Temperature is transmitted as 16-bit unsigned integer (0.00229 °C/bit). Looking at the data the temperatures look somewhat implausible (see picture below) - what went wrong most likely?
AI image description
Line graph titled "Cell Temperature". The horizontal axis is "Measure Time [s]" (extending to about 265 s), and the vertical axis is "Cell Temperature [°C]" (0 to 160 °C). A blue line labelled "expected data" is nearly horizontal at approximately 38–40 °C. A red line labelled "actual data" repeatedly rises approximately linearly from near 0 °C to roughly 145 °C and then drops almost vertically to near 0 °C, producing several sawtooth cycles; the final visible red segment rises to about 75 °C.
- The signed-ness is wrong
- The endianess is wrongCorrect
- The can bus is overloaded
- The conversion factor is wrong
- This is actually the cell voltage
Official answer
The endianess is wrong
Departments
Not tagged yet.
Occurrences
- FSA 2017 · ev · quiz 11