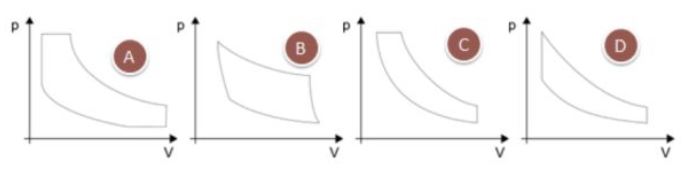
Which pressure- specific volume diagram depicts the ideal Otto-cycle?
AI image description
Four small pressure–volume (p–V) diagrams labelled A, B, C and D, arranged left to right. Each has a vertical p axis (upward arrow) and horizontal V axis (rightward arrow) and a different closed curve composed of curved and straight segments. In A and C a short flat top segment at low volume precedes a descending curved segment; C also shows a vertical segment on the right. B has a sloped left-hand segment and a near-vertical right-hand segment, joined by curved upper and lower paths. D has a steep sloping left segment, a smoothly descending upper curve and a lower return path. No numerical tick labels are given.
- A
- B
- C
- DCorrect
Official answer
D
Departments
Not tagged yet.
Occurrences
- FSA 2021 · cv · quiz 15