In the illustrated thermodynamic cycle of an ideal gas, the values for p1=6.5bar, V1=0.7m3, V2=2.1m3, p4=1.2 bar and T1=800K are given. The value T3 is to be calculated in Kelvin! Round solution to one decimal place.
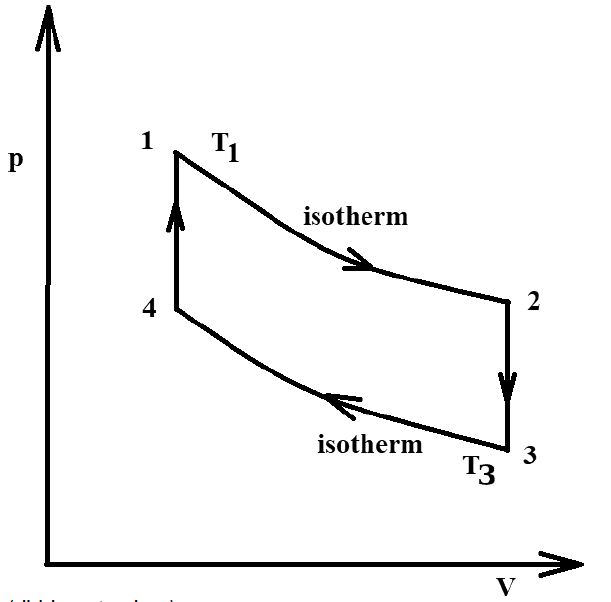
AI image description
Pressure–volume cycle diagram with p increasing upward and V to the right. Four state points form a loop: 1 at upper left, 2 at mid-right, 3 at lower right and 4 at lower left. The upper curved branch 1→2 and lower curved branch 3→4 are both labelled 'isotherm', with arrows along those directions. Branch 2→3 is vertical downward and branch 4→1 is vertical upward. Temperature labels T1 and T3 are placed next to points 1 and 3, respectively.
- 147.7Correct
Official answer
147.7
Departments
Not tagged yet.
Occurrences
- FSG 2021 · ev · quiz 16