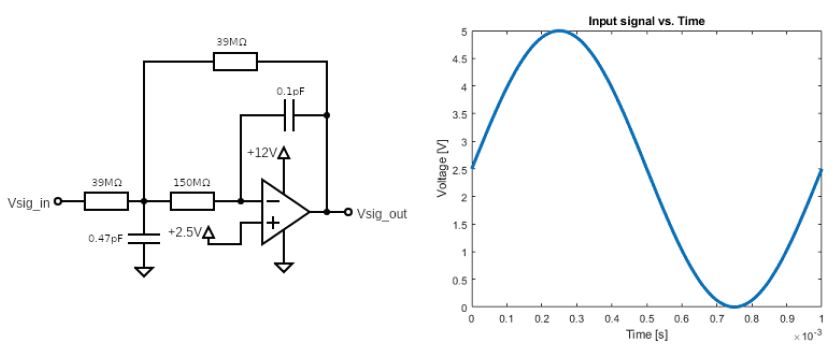
Your suspension team member wants you to measure a certain signal. You encounter quite some noise and want to filter the higher frequencies out that are not of interest and opt for the following active low pass filter configuration (multiple feedback filter) and the given input signal. All components are assumed to be ideal. What will be the output signal?
AI image description
Left: active op-amp filter schematic with Vsig_in passing through a 39 MΩ resistor to a junction, then through 150 MΩ to the inverting (−) input. A 0.47 pF capacitor connects the first junction to ground, and a 39 MΩ feedback resistor connects the first junction to Vsig_out. A 0.1 pF feedback capacitor connects the inverting input to Vsig_out. The non-inverting (+) input is biased at +2.5 V; the amplifier supply is marked +12 V and ground. Right: 'Input signal vs. Time' graph, voltage [V] from 0 to 5 versus time [s] from 0 to 1×10⁻³, showing one sinusoidal cycle starting at about 2.5 V, peaking near 5 V at 0.25 ms, reaching roughly 0 V at 0.75 ms, and returning to 2.5 V at 1 ms.
AI image description
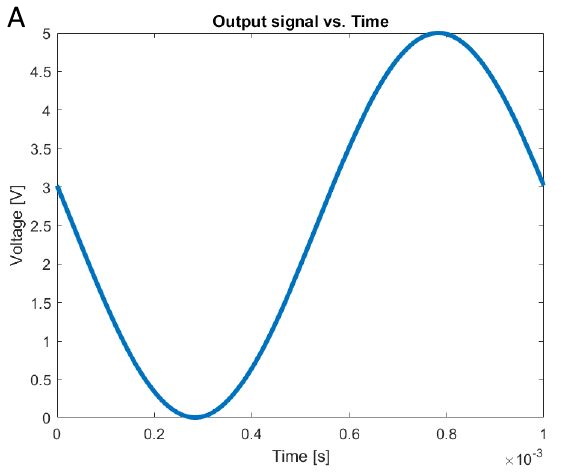
Graph A, titled "Output signal vs. Time": horizontal axis Time [s] from 0 to 1 with a ×10^-3 scale (0–1 ms), vertical axis Voltage [V] from 0 to 5. The smooth blue waveform starts near 3 V at t=0, descends to approximately 0 V at 0.3 ms, rises to a peak of approximately 5 V at 0.8 ms, then decreases to about 3 V at 1 ms. No flat clipping sections are visible.
AI image description
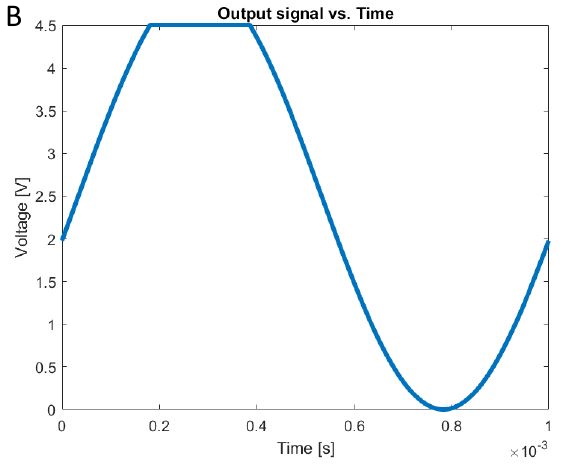
Graph B, titled "Output signal vs. Time": Time [s] on a 0–1 ×10^-3 scale; Voltage [V] on a 0–4.5 scale. The blue trace begins at approximately 2 V, increases to 4.5 V by about 0.18 ms, stays flat at 4.5 V until about 0.38 ms, then falls smoothly to 0 V near 0.78 ms and returns to about 2 V at 1 ms. The upper part of the waveform is visibly flat.
AI image description
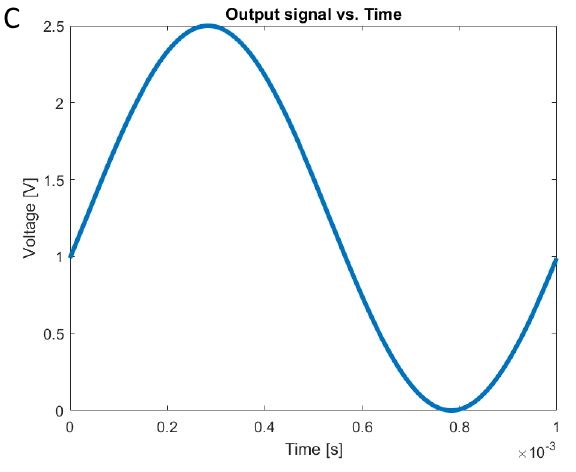
Graph C, titled "Output signal vs. Time": Time [s] from 0 to 1 ×10^-3 and Voltage [V] from 0 to 2.5. A smooth blue sinusoid-like curve starts at about 1 V, reaches a maximum of about 2.5 V at 0.28 ms, drops to approximately 0 V at 0.78 ms, and rises back to about 1 V at 1 ms. No visible plateau or truncation.
AI image description
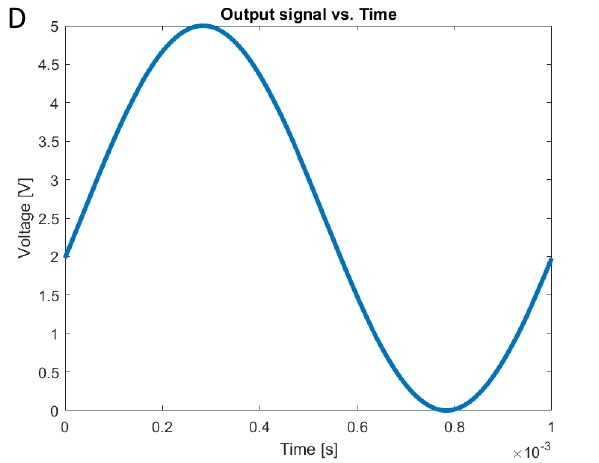
Graph D, titled "Output signal vs. Time": Time [s] from 0 to 1 ×10^-3 and Voltage [V] from 0 to 5. Smooth blue curve starts near 2 V, peaks near 5 V at around 0.28 ms, falls to 0 V around 0.78 ms, and ends around 2 V at 1 ms; the extrema are rounded rather than flat.
AI image description
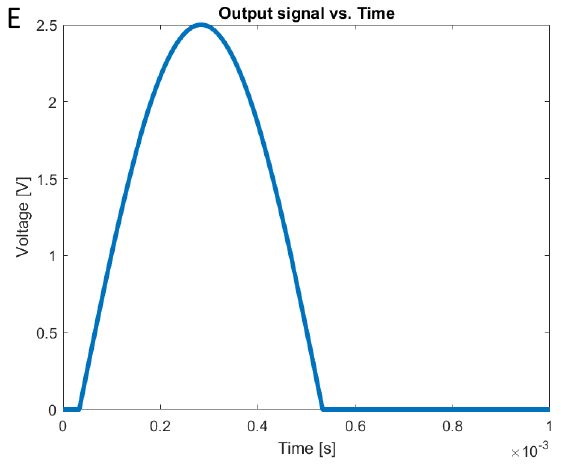
Graph E, titled "Output signal vs. Time": Time [s] from 0 to 1 ×10^-3 and Voltage [V] from 0 to 2.5. The blue trace is initially 0 V for a short interval, rises as a positive rounded pulse to about 2.5 V near 0.27–0.30 ms, returns to 0 V around 0.52 ms, then remains flat at 0 V for the rest of the plotted time. There is no negative-voltage section shown.
AI image description
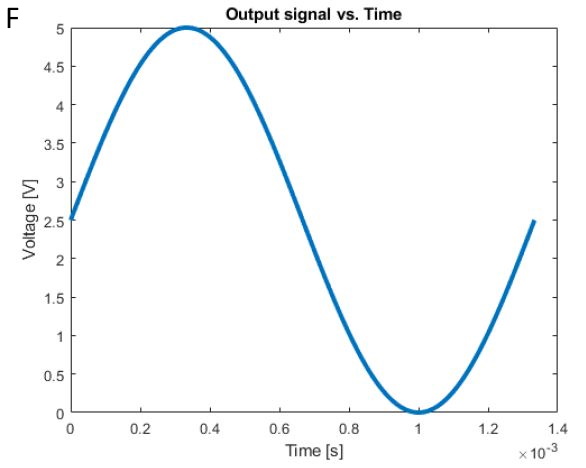
Graph F, titled "Output signal vs. Time": Time [s] extends from 0 to approximately 1.35 ×10^-3 (ticks through 1.4 ×10^-3), while Voltage [V] runs from 0 to 5. A smooth blue waveform starts near 2.5 V at t=0, peaks around 5 V at 0.33 ms, reaches approximately 0 V at 1.0 ms and rises to about 2.5 V near the right edge; unlike most other options, the displayed time interval exceeds 1 ms.
AI image description
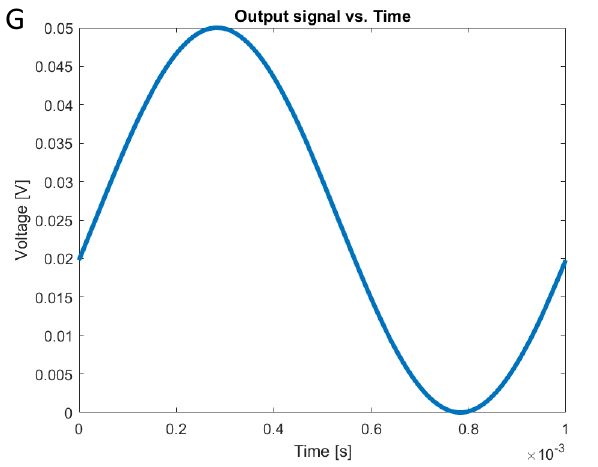
Graph G, titled "Output signal vs. Time": Time [s] from 0 to 1 ×10^-3; Voltage [V] from 0 to 0.05, with ticks of about 0.005 V. A smooth blue wave starts around 0.02 V, reaches about 0.05 V at 0.28 ms, falls to 0 V near 0.78 ms, and returns to about 0.02 V at 1 ms. Its voltage scale is much smaller than the other graphs.
AI image description
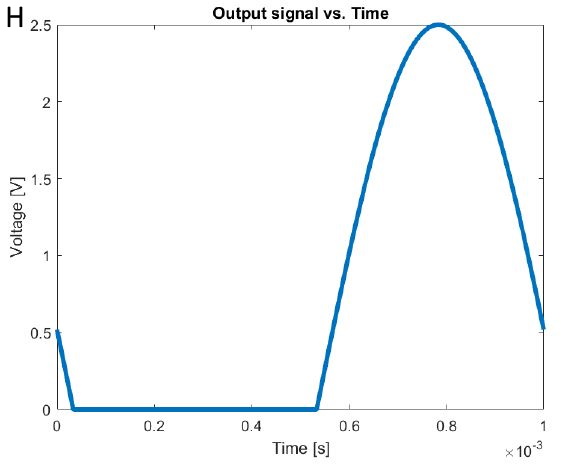
Graph H, titled "Output signal vs. Time": Time [s] from 0 to 1 ×10^-3 and Voltage [V] from 0 to 2.5. The blue trace begins near 0.5 V, drops quickly to 0 V just after t=0, stays flat at 0 V until approximately 0.52 ms, then rises in a smooth rounded positive pulse to roughly 2.5 V at 0.8 ms before falling back to about 0.5 V at 1 ms.
- ACorrect
- B
- C
- D
- E
- F
- G
- H
Official answer
A
Departments
Not tagged yet.
Occurrences
- FSG 2021 · ev · quiz 16