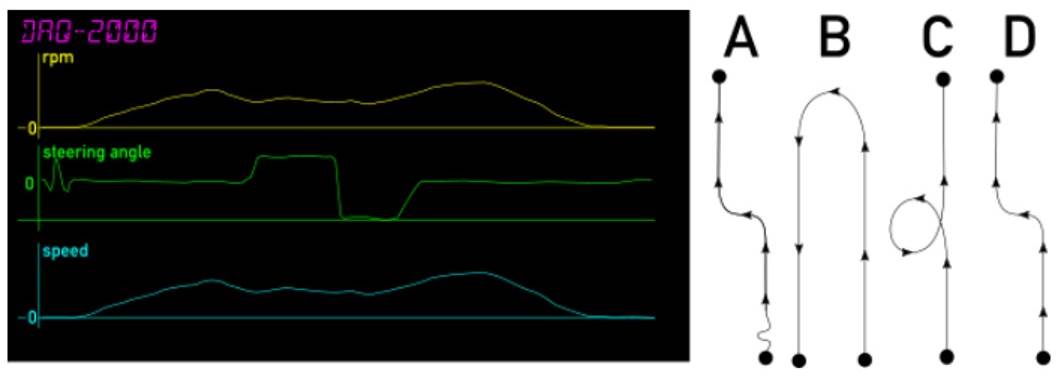
Which driving trajectory fits the data shown in the diagram?
AI image description
Two-part figure. Left is a black-background recording of three stacked traces over a common horizontal time axis: a yellow top curve labeled "rpm" begins and ends at baseline and has two rounded speed peaks; a green middle curve labeled "steering angle" has a brief positive-looking plateau followed by a sharp negative-looking dip and recovery; a cyan bottom curve labeled "speed" rises from baseline, has undulating intermediate sections and a broad later peak, then returns to baseline. At top left a magenta readout resembles "DRD-2000". Right are four possible driving paths marked A, B, C and D, drawn as black line trajectories with direction arrows and filled circular end points. A is a mostly straight vertical path with a small bend near its upper section; B contains a tall elongated hairpin loop; C contains a circular loop alongside a near-vertical path; D is a near-vertical path with a lateral kink and return. No numeric time or speed values are displayed.
- A
- B
- C
- DCorrect
Official answer
D
Departments
Not tagged yet.
Occurrences
- FSA 2019 · ev · quiz 3
- FSA 2019 · cv · quiz 4